
Reading time: 6 min

The WhyR Foundation, with the support of McKinsey&Co, organized a region-wide „Text Mining Hackathon” in September, which our team won with its solution for churn analysis. In this article we summarize the analysis and tell about our experiences.
Four „challenges” were identified in the competition, all of which targeted machine learning based on text mining. The competitors had to work with data from a community forum called Hacker News, which unites various topics, questions, job offers, and the users can respond to them in comments.
We represented the Hiflylabs Analytics team by five of us at the 24 hours hackathon.
Csendes Gerold, Molnár Bence, Rábay Kristóf, Szokolics Dániel, Farsang Bence
Goal
During the challenge, through analysis and modelling, our goal was to help the Hacker News in understanding what factors drive users to churn and when does a change happen in their behavior that is followed by churn. We also wanted to identify users who have a high probability to churn in the future.
Data collection and preparation
In the first round, we collected all the data about users, posts and user comments over the past 2.5 years with the use of the Hacker News API. Then we defined the definition of churn, therefore we were able to label churning users: we classified churning users who were inactive for at least one month after any activity within 3 months after registration (i.e. they did not post or write a comment).
In parallel with the data collection we started data cleansing and creating variables that can be used for modelling on the sample data. These can be divided into two categories:
- Activity indicators: descriptive variables based on users’ usage habits (number of comments written, number of posts posted, time since last activity, etc.).
- Text analysis indicators: we extracted information from the comments, such as how many questions, hyperlinks were in it, how many words were in the comments. We also ran more complex NLP (Natural Language Processing) analyzes on the comments. Using sentiment analysis (sentiment analysis = identifying neutral, positive or negative expressions in texts) we looked at whether the emotional charge of comments was neutral, positive, or negative. With the use of LDA (Latent Dirichlet Allocation) analysis we segmented the posts along topics. LDA categorizes the text based on related words based on their location assuming that texts on a topic have a similar vocabulary.
After the data collection we built our „analytical base table” in which we labeled the users based on our churn definition and included the explanatory variables.
Analysis and modelling
Once the ABT was created we performed descriptive analysis on our data and proceeded to build models that predict churn. After testing several classification models, we decided to use logistic regression because its results are easier to interpret and also because we can answer several questions of the challenge based on the coefficients extracted from the model.
The following ROC curve (ROC curve = graphical method for evaluating classification models’ performance) also confirms that our model performed quite well. The larger the area under the ROC curve (Area Under the Curve, AUC), the better the predictive power of the model is.
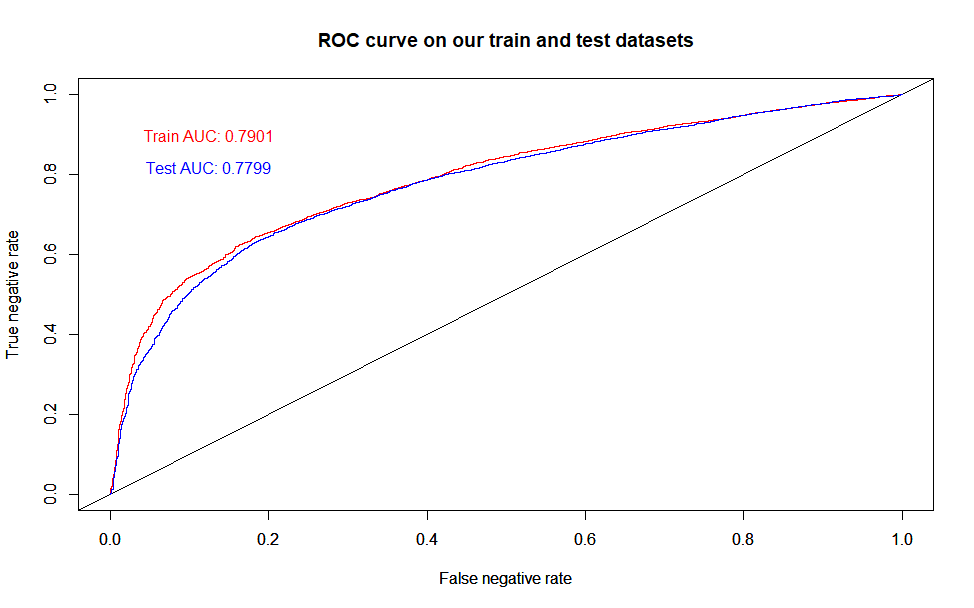
The AUC value close to 0.8 means that 8 out of 10 cases our model assigned a higher churn probability to those users who actually churn, than to those who did not churn. This result is particularly good among models which predict churn.
The characteristics of churning users
The churn of HackerNews users is mostly influenced by the variables, “factors” shown in the figure below. The most important factors were selected based on the regression coefficients.
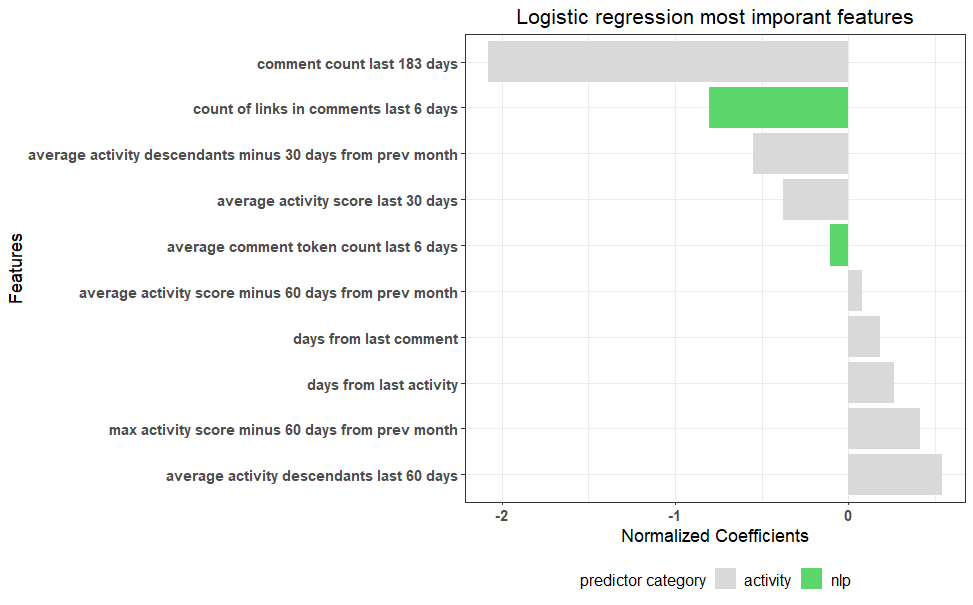
Among the activity variables, “number of comments written in the last 183 days” reduces the probability of churning the most, and, among the variables generated during text mining processing, “number of links in comments in the last 6 days” and “average number of words in comments in the last 6 days” reduce the probability the most. Churn probability is increased the most by “number of reactions to user posts and comments in the last 60 days”.
Preventing churn
The business goal of the analysis was to detect changes in users’ page usage patterns and even prevent churning in time.
After identifying the churning users we examined what trend describes their activity based on the comments they wrote on HackerNews.
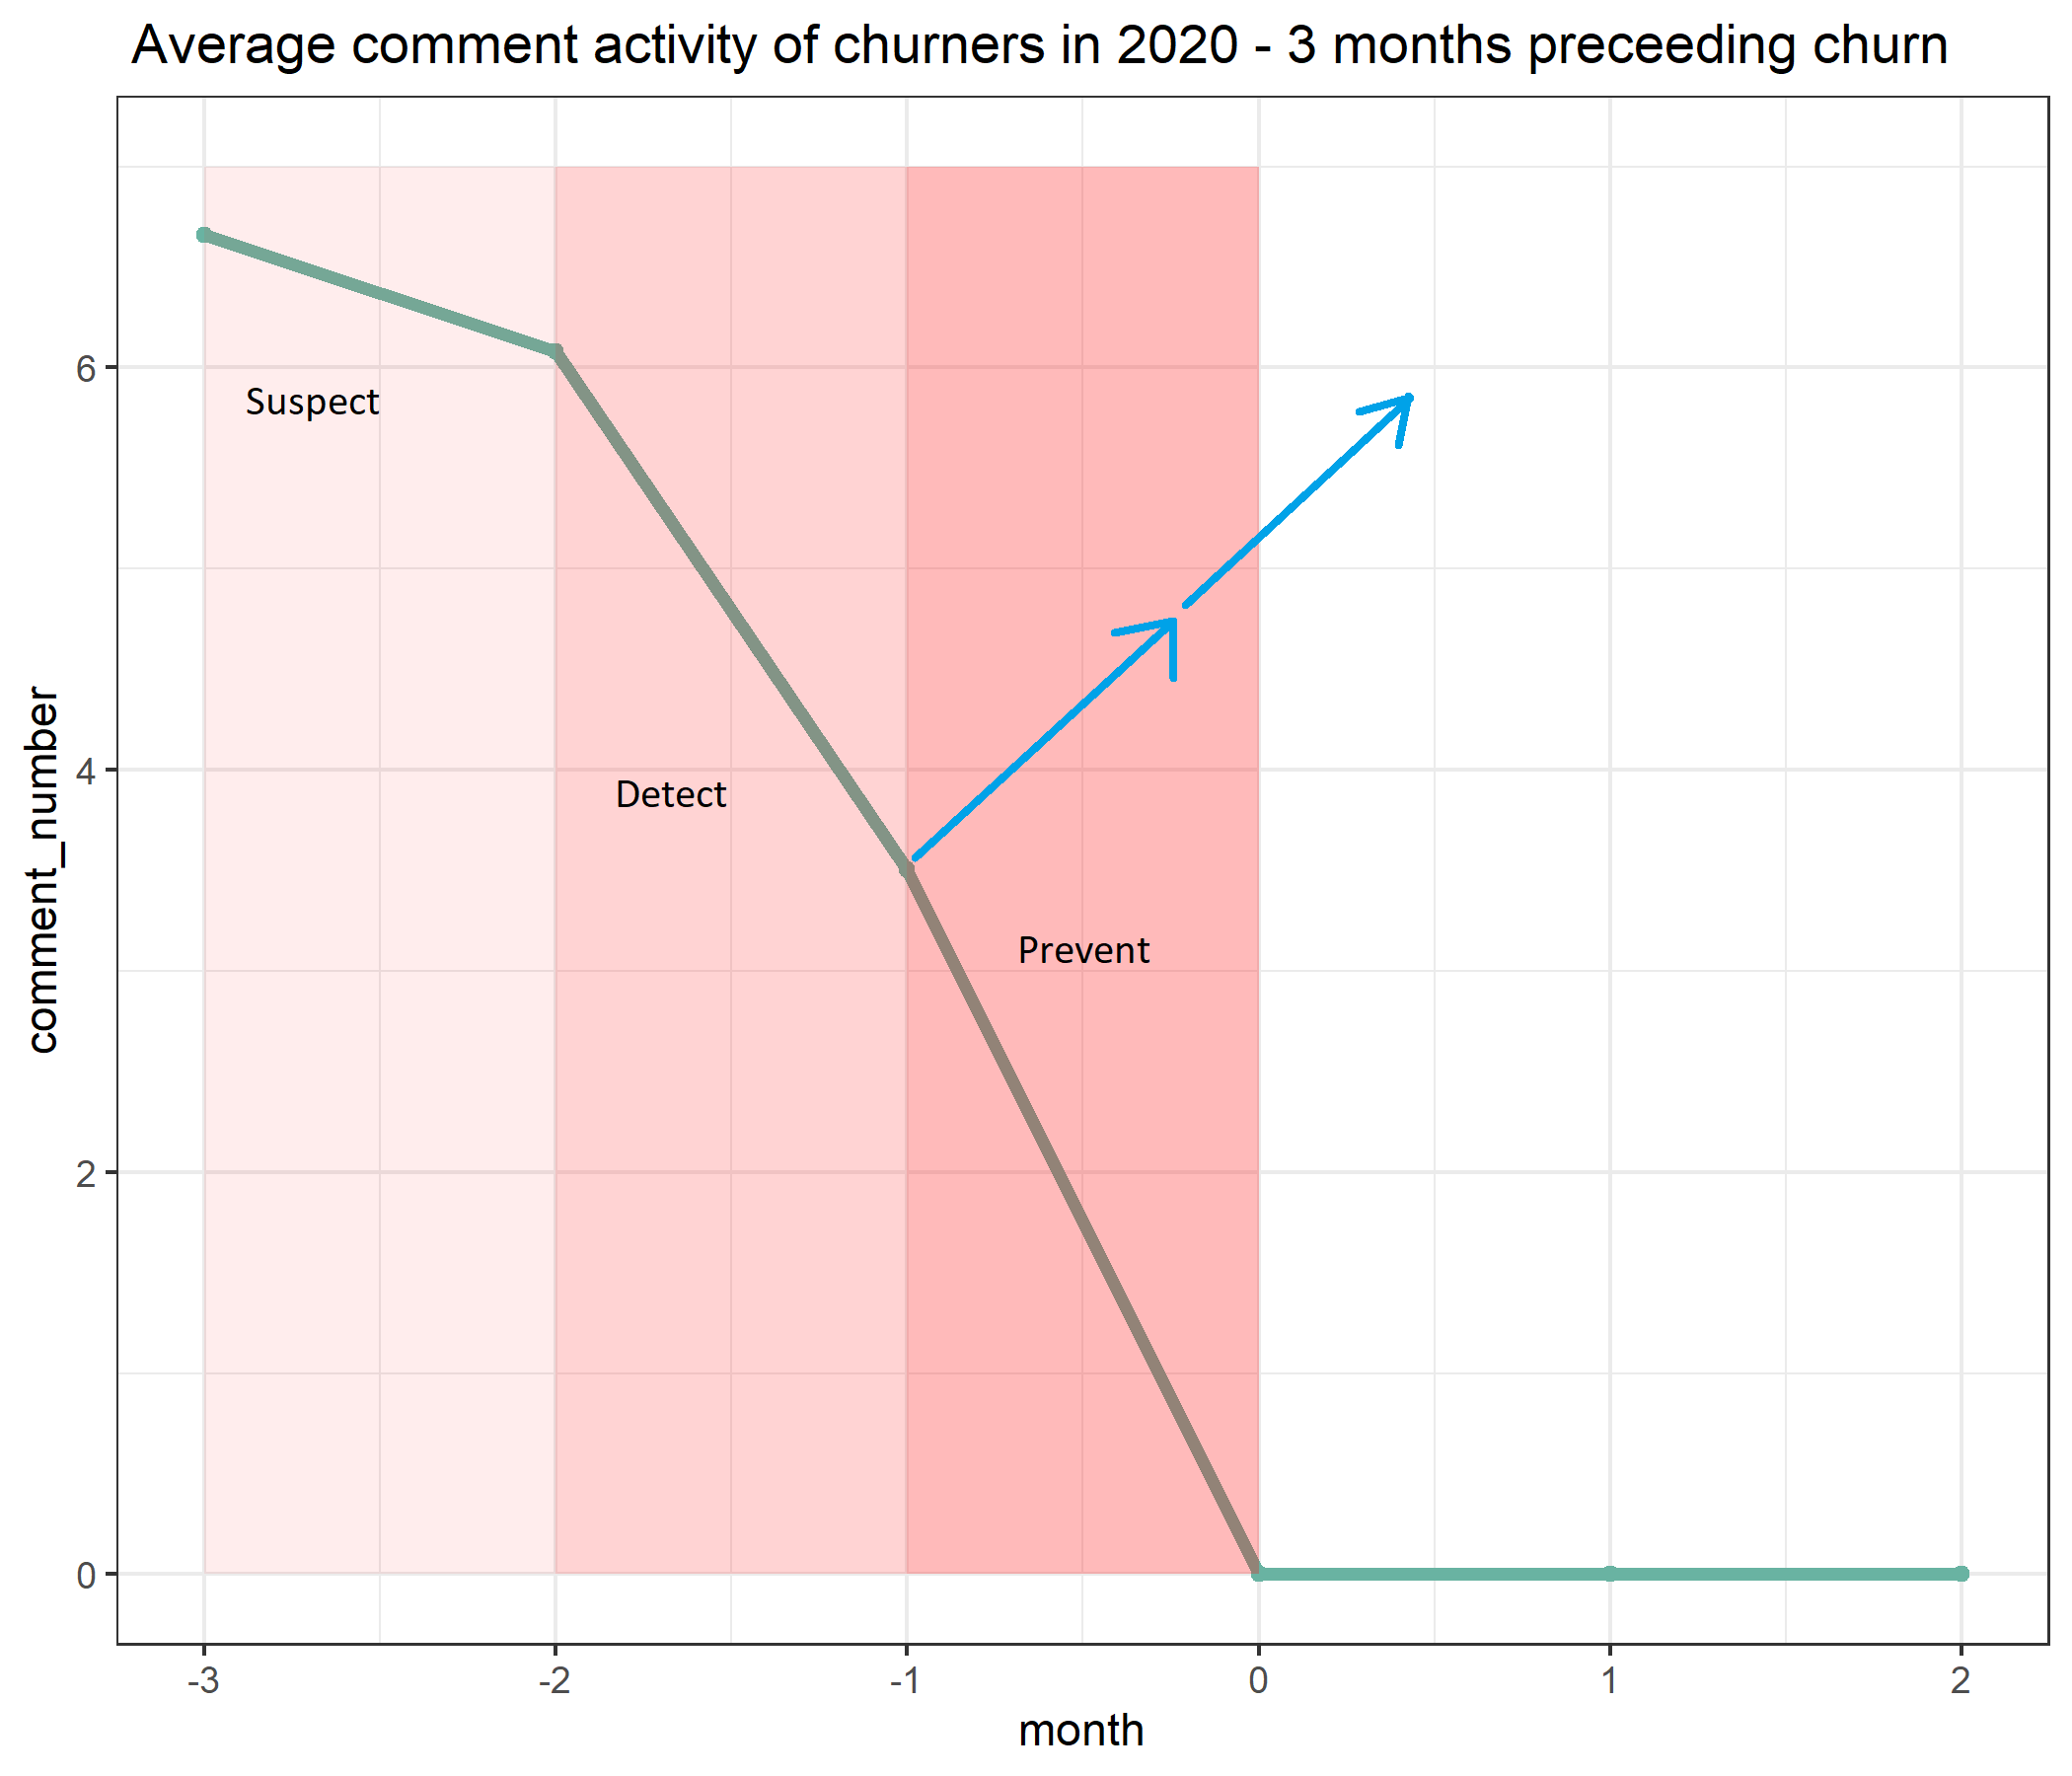
As it can be seen in the figure the trend of commenting habits of high probability churning users is decreasing. If the activity has decreased during the 2 months prior to churn, it can be an early warning and churn can be prevented by various methods, such as gamification or personalized newsletters.
Summarising video
We had to present the solution and the achieved results to the jury in a video of up to five minutes. The winning solutions were also published on Youtube by the WhyR Foundation.
Gained experiences during the hackathon
Although our team members had already worked on many projects together, the hackathon was a new challenge for us and we gained a lot of experience. The 24-hour time limit required us to define responsibilities from the start and to work in parallel. The key to our success was that by the end of the hackathon all the threads came together and we were able to put a complete solution in front of the jury. However, smooth communication within the team and helping each other also defined our work.
We collected more data in order to give better predictions with a more accurate model. An important lesson was that in such a short time, and with so much data, it is not worth doing more complex tasks, because it turned out quickly that more complex analyzes did not run in time.
Overall, we think that an intense hackathon-like working format can be effectively applied to normal business projects as well because the strong time limit requires us to focus on the most important tasks. At the same time, of course, it is also true that after 24 hours of “hackathoning”, we are much more tired then after three normal working days…
Author: Bence Molnár – Junior Data Scientist