
Reading time: 5 min

Table of Contents
- Introduction
- Scraping twitter and using Amazon comprehend in R
- Sentiment Analysis
- Conclusions

Photo by Lidya Nada on Unsplash
Introduction
This article was written as part of a university project and since it is my first one on Medium, I would be flattered for all kinds of feedback. I also want to highlight the fact that what you are about to read is rather technical and the emphasis will not be on the analysis itself but rather on how you set up a framework to do a sentiment analysis easily. With all that being said, let’s come up with a use-case for which this framework can be applied.
Imagine that you are an owner of a renown football club in England and you want to find out what the fans think about the club manager. How can you do this on your own in a time- and cost-effective way? With some basic coding skills and an Amazon Web Services account with as little as 5$, you can get a nice overview about the trends of fan’s satisfaction towards the manager’s performance. Without further ado, let’s dive into the tweet sentiment analyis! My code for this article can be found here: github.
Scraping Twitter and using Amazon Comprehend in R
In order to use Twitter’s API to scrape tweets, you need to have a Twitter account and to create a Twitter application here. I took me about 40 minutes setting up the application because there are a bunch of forms to fill in but I ended up receiving the permission to my application in only a matter of minutes. By the way, this article provides a nice summary on how to do this.
Once you are done with this, you should see on your developer dashboard something similar (I just blurred my keys and tokens for security) :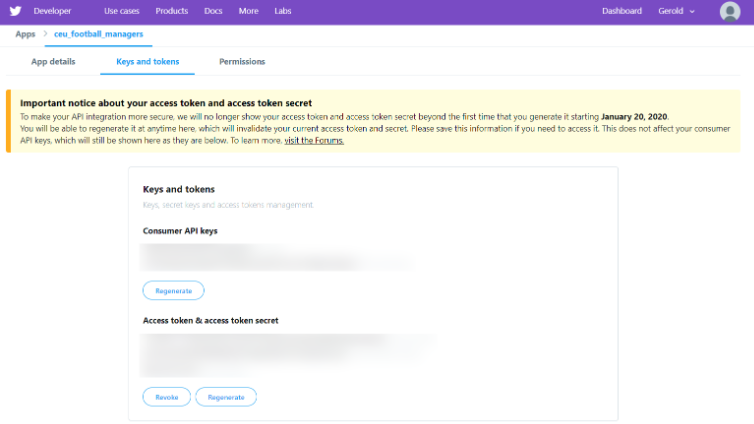
Twitter Developer Dashboard
One of the R packages you can use to use Twitter’s API is rtweet. You can create token in rtweet using your credentials with a code like this:
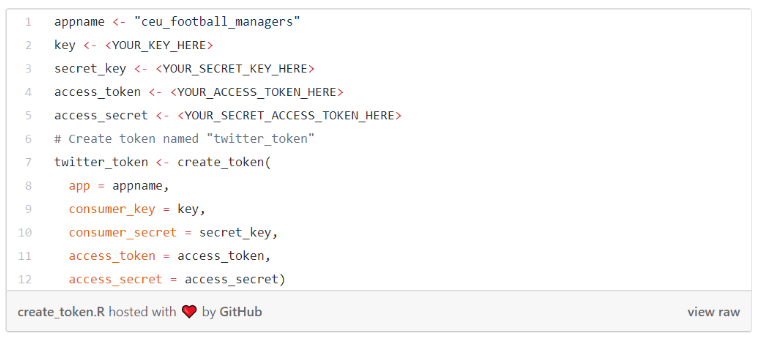
Create a token in rtweet: link.
Okay, so now we can communicate with Twitter in R. The next step is set up to access Amazon Comprehend. You obviously need an AWS account for that, so if you don’t have it, it is time create one. It should not take more than 10 minutes. Once you have an account, an access key has to be generated on Amazon’s Identity and Access Management (IAM) Console for secure communication with the API. On the dashboard, you will probably see something very similar. Create an access key and save it to your R project’s location.
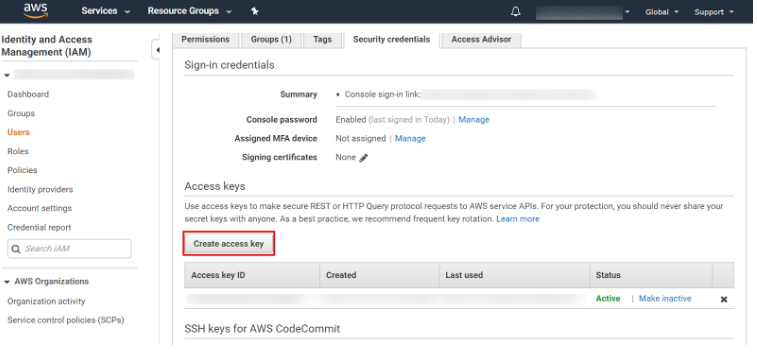
Amazon IAM dashboard
R’s package to use Comprehend is aws.comprehend. To be able to use Comprehend from R, we need to provide the access keys to aws.comprehend. If you want to find out how it works in more detail, check this github page out.
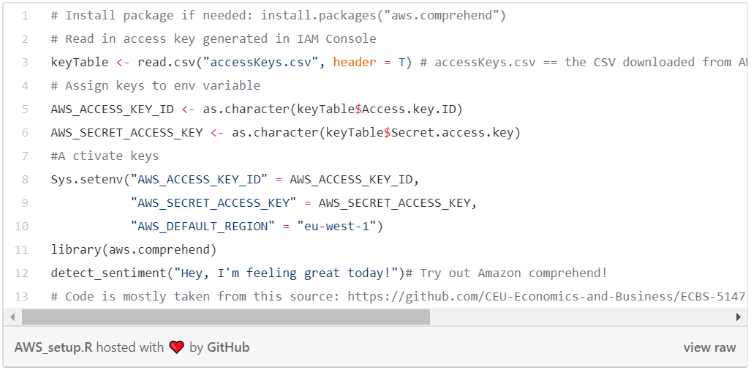
Set up Comprehend: link
Okay, we have set up everything that is needed to carry out that sentiment analysis on football tweets. Let’s get to work!
Sentiment Analysis
For my sentiment analysis, I am only going to analyze tweets in English, though Amazon Comprehend supported 5 other languages at the time of writing this article. I wanted to further restrict the tweets by geographical location on a country level because I think fans have more influence on clubs who live in the motherland. It turned out that although the Twitter API provides some geographical data, these are poorly filled. Thus, I decided to keep all tweets in English.
You should note that Twitter poses some restriction on requesting tweets. Currently, the supported tweet history is 7 days, so one should plan ahead if he want so analyze the tweets for a specific future event or act quickly when something unexpected happens. Twitter also limits the requests you can make but I haven’t found any information about this. What I know is that I was able to make 36.000 requests within 30 minutes, so twitter doesn’ really seem very restricting.
As a subject to my analysis, I chose Pep Guardiola, manager for Manchester City. City lost 3–1 against Liverpool securing Liverpool an 8 point advance in the Premier League. I wanted to find out how the football fans reacted to this loss. This game was 5 days before doing this analysis, so I was right on time.
Getting and cleaning tweets
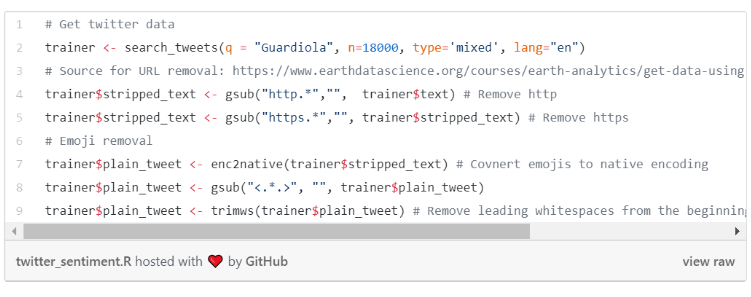
To fetch tweets from the Twitter API, simply use rtweet’s search_tweets() function. You will see that twitter provides the data in a dataframe with 90 columns and you can also get additional ones. Check out rtweets documentation on further possibilities.
The text column contains the tweets from the users. Tweets usually contain URLs and emojies and I that by removing them, we can help Amazon Comprehend to make a better guess about a tweet’s sentiment. By the way, emotions may be easier to detect just by analyzing emojies than by text. I found no information indicating whether Comprehend could use emojis for its sentiment detection. It may be really exciting to conduct a sentiment analysis only on emojis and compare its results against Comprehend.
So let’s get rid of those emojis for our current analysis. I concluded that R’s base enc2native function works the best to convert tweets with emojies into UTF coding standards without losing any other information. I included this code snippet with the most relevant steps but you can find the full code on my github.
Actually rtweet has a function called plain_tweets() which should apply the same cleaning techniques I did but I found it worse performing than my methods.
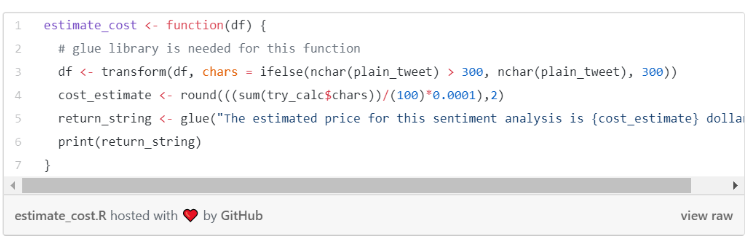
We are now done with the data cleaning but before jumping into sending sentiment requests to Amazon, it would be nice to get a cost estimate. Amazon Comprehend is reasonably priced but we don’t want to end up paying more than our budget due to some error. For this purpose, I created a function which estimates the job’s cost.
Amazon charges 0.0001 dollars per 100 characters and a minimum of 0.0003 dollars per request (meaning that you pay the same for a 100 and a 300 character tweet). My dataset contains 17,997 observations and estimated 5.2 dollars for the whole dataset.
It is worth to mention that though Amazon Comprehend doesn’t seem to be an expensive solution, it is still not optimally priced for tweet sentiment detection. Tweets -when removing emojis and URLs- consist of a lot less characters than 300. To illustrate this, I included a plot about character distribution for my dataset.
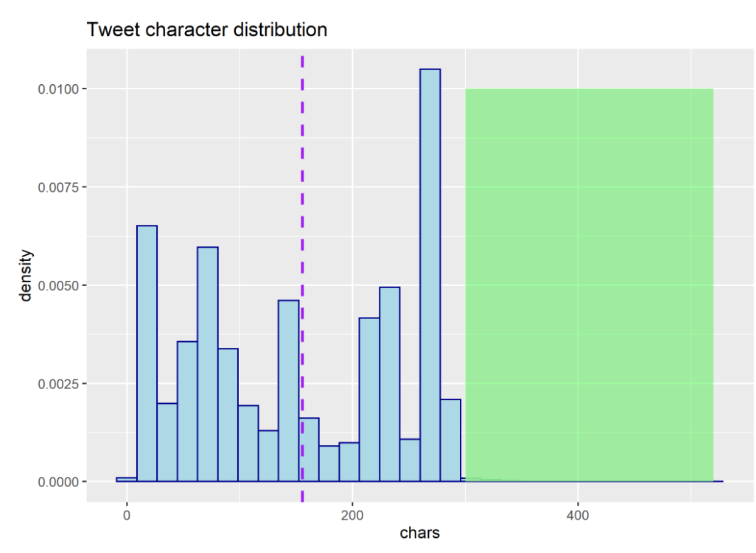
The average tweet length is 157 characters and only 0.3% of the tweets have more than 300 characters but about 24% are longer than 250 characters. We might worry whether this number of characters is enough to express feelings. Just to give you an idea how many is 157 characters, I added a tweet this long:
“@<blurred_user> is a very good manager, no doubt, but he always had best team as his disposal. Klopp has made average teams become excellent teams.”
We don’t necessarily need longer tweets to detect sentiments it may be even that shorter ones like “Booo Guardiola” or “GTF Guardiola” tend to be either negative or positive and longer ones neutral. Anyways, I am no expert in NLP, just wanted to provide some context to my analysis.
So while it may be not financially worth to request sentiments for shorter texts from Comprehend, it should still work.
Detecting sentiment
When using Amazon Comprehend, we get back as a result a probability score for the 4 sentiments and the most likely sentiment will be flagged in the ‘Sentiment’ column. With that in mind, we can define a function which extracts the tweet column, sends it to Amazon and merges the returned dataframe to the ‘base’ horizontally.
And that’s it! We have now a dataframe with tweets and their sentiments. It is time to see what people think about Pep Guardiola after losing the big game.
So, first I want to take a look at the date range of my dataset. It turns out that the tweets fall between 12.11.2019 and 15.11.2019 (the time of writing this article). It is quite unlucky because I was hoping for tweets on the day of the game (10.11), since I was expecting the fans to be more harsh in the heat of the moment and then gradually become more understanding. I only came to realize after conducting my analysis, that you can pass in an ‘until’ argument for the Twitter API which returns tweets before a given day. You can find more information about this here.
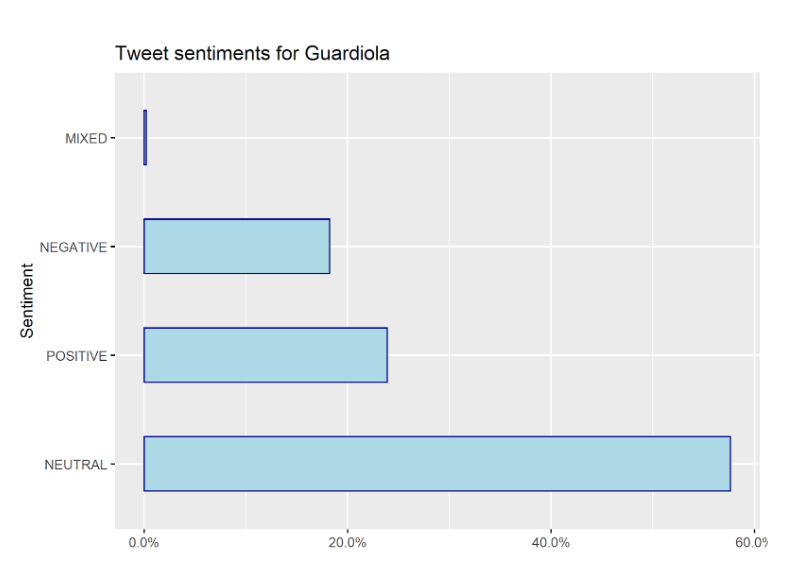
Anyway, as I already expressed, this article aims at only showing a framework and doesn’t necessarily go for an error-free analysis. So keeping that in mind, let’s take a look at the tweet sentiment relative frequencies. As you can see, the neutral sentiments dominate with 57% followed by the positives with about 23% and negatives with 18%. Tweets with mixed sentiments can be ignored.
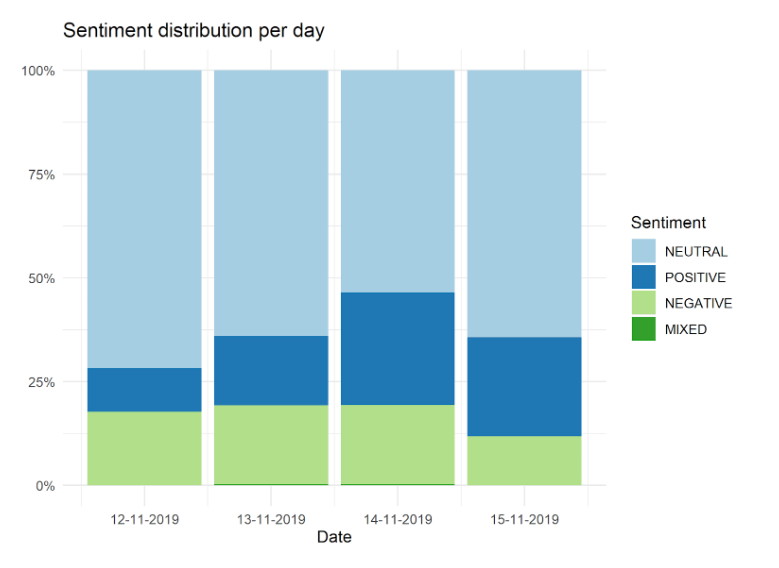
As mentioned before, it may make sense to see how tweet sentiments evolve in time after the game. If we take a look at the chart below, we can see the pattern that neutral sentiments decrease which is caused by the increase in positive sentiments while negatives remain quite unchanged. So it may be as I suspected that fans become more and more understanding after losing a big game and this is why the positive tweets increase relative to the negatives.
Conclusions
In this article, I demonstrated how Amazon’s Comprehend can be used in R to detect tweet sentiments. It is very easy to set up this framework and you can analyze what people think about a specific event by applying the same method. I consider this as a time- and cost-efficient way of doing a quick sentiment analysis. The questions remains whether Amazon Comprehend works well enough for our purposes. In the near future, I am planning to compare Amazon Comprehend sentiment predictions to emojis and see how these relate to each other and then preferrably write an article about it.