
Reading time: 3 min

Case study:
How to price your convenience stores?
This case study describes our results of a recently completed project. Our partner has shops in hundreds of locations, where impulse products give the major part of the revenue. One feature of these kind of products is that their consumption patterns are related to the location of the business, thus it is worth differentiating pricing on a location basis.
The system of location rules has developed over the years and decades, but experts estimate there is plenty of space for data analysis-assisted validation and optimization.
Our main goal was to set the optimal price level at certain locations and reach maximum margin growth.
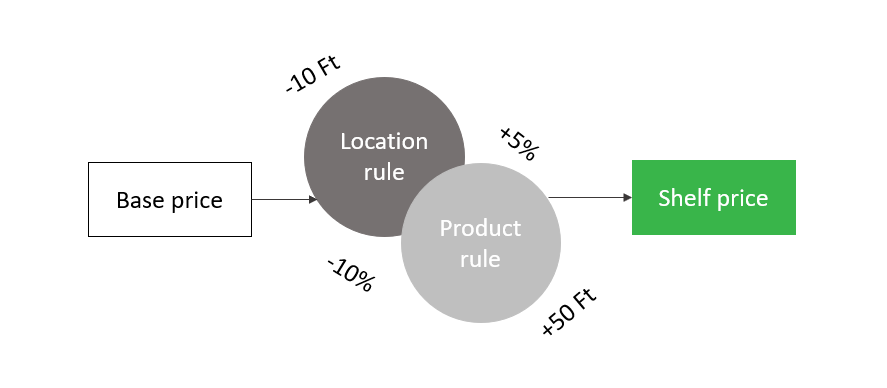
We developed a customized pricing methodology: instead of the classic pricing model, we developed a product group + shop based model. This was used at the store level in aggregate.
Detailed purchase data and other external data (for example promotions, available information on store renovation periods) were also used for analysis.
In the following, we describe the steps of the analysis.
1.Filter out distortions!
We have seen a type of mineral water that brought in the sales volume thirty-five times by using a strong marketing activity month after month, then the yield declined to re-promotion status next month. One popular energy drink was offered at bargain price every two months, therefore, we have experienced tremendous fluctuation in quantity. Most of the shops were open during renovation, but most product groups were not offered for sale, and the other product for sale indicated upgrading reduces in traffic. We filtered out outlier values, which otherwise affected the model adversely, so we ended up keeping 60% of the stores and 20% of the products.
As a result, we could develop a reliable model, which is free from interfering effects, but is still based on a representative sample.
2.Assign a clear price to product-store pairs!
The business didn’t record the shelf price of the products to an easily accessible database. Many products were sold at several different prices, and lower prices were available with a loyalty card discount, multibuy discount or coupon. We needed shelf prices, because these influence customer decisions. Fortunately, these prices changed rarely within a day, so we chose the daily median price, on which 97% of the quantity was sold.
3.Adjust quantity with seasonal effects!
That we can compare the quantity sold at different prices at different times, we needed seasonal adjustment. Impulse products have strong seasonal (weather) effects, which affect their sales volume regardless of their selling price. Higher rate means higher traffic, lower rates means weaker traffic. Typical seasonality is the surge in the consumption of frozen products and drinks during the summer.
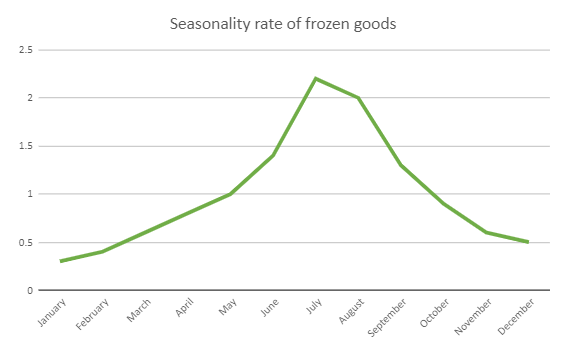
With the seasonality rate, we can normalize monthly sales to get a monthly sales volume.
4.Determine price elasticity of demand at store + product group level!
Price elasticity of demand of a product shows that a 1% price change causes a percentage change in demand. We approached this from past price-sold quantity data. In this project we fitted a price elasticity curve to the price-quantity data points at the store + product group level.
The effects of the outliers were reduced with a few tricks, for example, we used robust regression and calculated a confidence indicator to filter out poorly performing models.
5.Raise the results to store level!
The store + product group models were aggregated to store level by weighted averaging. By using this method, we got an indicator for all stores showing the price elasticity of the customers visiting that store.
6.Set optimal prices!
We can determine an optimal price on shop level compared to the last known price of the given product, and by setting this, the product of unit margin and quantity is maximal, and the total revenue can be raised. Based on the results, the optimum of the total selection showed a higher total margin than the current one. As usual in retail, instead of the prices given by the model, we rounded them to psychological price points. We could not determine e.g. a price of 66,5 HUF, therefore, a rounding system changed the prices to the psychological price points (e.g. to 69 HUF) as a last step.
As a result, our model estimated an annual 3-3.5% rise in margin at our customer, which is approximately equal to the profit growth of opening ten new shops.
The methodology works, we successfully optimized the price for location differences. Besides, there are significant opportunities forward – for example product-level pricing and production system development. Industry trends show, that in the increasing competition, more and more retailers have the opportunity and need to make data-driven optimization decisions with improved data quality and availability.
Authors:
Marton Biro (Senior Data Scientist)
Marton Zimmer (Managing Partner)