
Reading time: 3 min
(Disclaimer)
For a company that is truly devoted itself to data-driven organizational operation, the question is not whether they need a dashboard tool, but which tool suits their needs best.
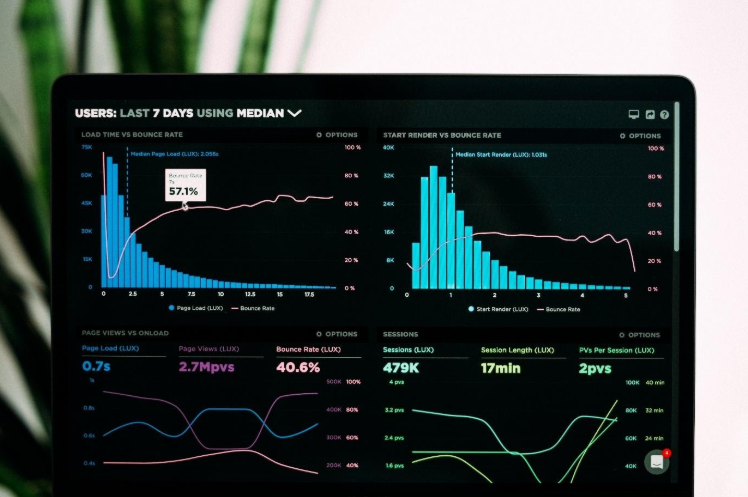 Photo by Luke Chesser on Unsplash
Tableau, Power BI, QlikSense or maybe open source? During the project preparation phase, these tools are discussed most often in the Hungarian market. If we want to answer this question properly, we need two things in the first place: 1) setting up a set of criteria that covers all dimensions of corporate needs, and 2) evaluating potential products within this set of criteria.
We can assume that producing such a report would go beyond the scope of a blog post, nor do we claim to be able do an evaluation in line with general market needs. We believe that each corporate use case is different, in which we weight the features of tools differently. Thus, it could easily happen that using a general scoring scheme would produce biased results for a given situation.
With this two-part series, our goal is to provide decision-makers with a dashboard selection guide that allow them to get started on the path to the optimal decision and also, get a general picture of the 4 most important participants (as we see). In the first part of the article, we present our evaluation criteria based on business experience. The second part summarizes our technical experience and presents the “big 4”.
Part One: Aspects you should consider before choosing a dashboard tool
- Pricing
- Enterprise technology stack
- Competence
- Graphics and customization
- Mobile view
- (Real-time analytics)

Pricing
The most important decision factor is usually the price of the tool, which is the most objective and perhaps the most complex factor in decision making. People with little knowledge of dashboard tool manufacturers’ pricing could close this topic by saying: “I need X user, let’s see which is cheaper!” Those trying to apply such a strategy will quickly face the following issues by browsing the manufacturers’ websites:
What do we mean by user? It matters how many will just “use” the dashboard or how many will develop it. These different levels of user types are priced differently by manufacturers, so defining the exact user base is crucial. Another issue is the cloud / on-premise environment, which can drastically affect the price of a subscription. Although it’s less common, it can even become the main decision factor if we want to embed analytics in our application. In this case, we will face special pricing and it is absolutely necessary to be aware of the business and technical conditions of the embedded analytics service. Finally, decision-makers need to be prepared for more abstract concepts such as token-based pricing and non-transparent pricing policies. If we encounter the latter, we should definitely expect a relatively longer negotiation period with the manufacturer.
Enterprise technology stack
A very important dimension is the company’s current technology stack. This can narrow down the product range greatly or even result in a clear choice right away. For example, a strong Microsoft or SAS culture is very much in the direction of Power BI and Visual Analytics, but even in these cases, there may be other influencing factors that modify the optimal choice.
Competence
Competences, both internally and on the labor market may influence our decision. The issue of internal competence is particularly important if we want to “use” but not develop the dashboard. It is worth utilizing existing competencies, but it is also important to keep in mind that you can also learn to use a new tool. This is when the available (free) tutorials and a good user community become decisive.
If we want to develop our dashboard in the future, we will need other development competencies. It is worth not underestimating the importance of the given labor market situation because currently, it’s not easy to find a good dashboard developer, in some technologies, it’s even quite impossible.
Graphics and customization
Unfortunately, the discussion of the highly subjective graphical dimension cannot be left out of the analysis. What’s beautiful and who likes what will never be consensual but we still need to deal with the graphics of the dashboard. It is important that our colleagues and clients like and enjoy the dashboards we develop for them, thus ensuring that the work and money invested pays off. In the project preparation phase, our clients tend to appreciate us demoing the same visualizations on each tool. This allows them to compare manufacturers more directly, which is much better than trying to compare dashboards posted on the manufacturers’ websites.
Along with the graphics of the product, it’s worth discussing how visualizations can be (simply) customized. In our experience, the basic settings of some products can be used to create more beautiful data visualizations, but it is relatively much more complicated to customize them. This can become an important aspect if maintaining the company’s graphic design is important (also) at this level.
Mobile
A common need is to display dashboards on a mobile interface. If the only expectation in this regard is that simpler visualizations are available on mobile and that basic filtering functions work, then any of the major manufacturers will be suitable. If our expectations are higher, which usually means we insist on high-quality display on mobile as well, we will clearly experience quality differences.
(Real-time)
Although real-time / near real-time applications are less common, they are worth mentioning because we are experiencing a growing demand for such dashboards and the 4 “big” manufacturers have different competencies here. In this case, it could easily happen that companies with smaller, more specialized solutions will be the winners instead of the big names.
Summary
We hope that we could convey the message that it is not worth choosing a manufacturer in a hurry, but approaching the problem consciously, with a well-defined evaluation system. Briefly, these are the minimum criteria to make a good choice: we know who, how many, and in what role they want to use the dashboard. Cloud or on-premise? We judge to what extent the chosen manufacturer fits into the current technology stack, both in terms of technology and competence, and if mobile visualization is required, express our needs as accurately as possible.
Gerold Csendes – Data scientist